Links to Contributors: Paxton Schroeder, Nicholas Colosimo.
Project Summary and Skills Used
We developed a trading platform that lets users simulate real stock market activity without any real financial risk. With this platform, users can monitor positions, place buy and sell orders, and evaluate potential trades before doing them. To help with trade analysis, the system runs a Monte Carlo simulation which makes thousands of possible future price paths for any stock. We built the project in Java with a good amount of classes and methods. We incorporated the TA4J library to perform technical analysis on stocks and used a Java wrapper for the Alpaca API to handle market data imports and order submissions. The Finnhub API was used to get the sector information for each stock. Since the whole team worked across the same files, getting a good GitHub workflow was essential to avoid messing up merging.
Project Development Process
The original idea was to have a fully automated stock screening system that would scan a broad section of stocks, pull historical price, and automatically place orders. These would show the entry price, when to sell, and when to stop-loss.
Once we began building we ran into API rate limits which forced us to scale back. Instead of automatically scanning a wide pool of stocks, we decided to do a user-driven model where the user inputs a specific ticker. The program would analyze it and then automatically place an order based on the results.
We also ran into a null bars error that happened when trades were attempted on weekend or on Mondays just as the market opened. We resolved this by adjusting our data collection logic to start the look-back period from a maximum of five months and work forward to present.
The final project was close to what we envisioned, but not quite everything we wanted. Some of the more advanced automation feature are locked behind the paid API section, but the platform still works well as an analysis tool. If it were ever adapted for real stakes trading, the upgraded API would likely be worth the investment.
Key Features
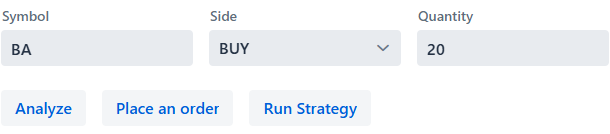
The main part of our platform is the trade analysis page, where users can input any stock ticker, select either buy or sell, and then specify a quantity. Clicking analyze then fill two sections: Signals and Monte Carlo Simulation.
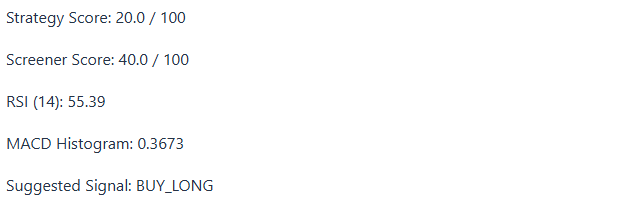
Signals provides a preview of the stock’s current technical standing. It calculates a Strategy Score and a Screener Score, the RSI (Relative Strength Index) and MACD Histogram. These indicators help identity momentum and trend direction. It also outputs a Suggested Signal, which in this case is Buy Long, giving the user a recommendation based on the data.
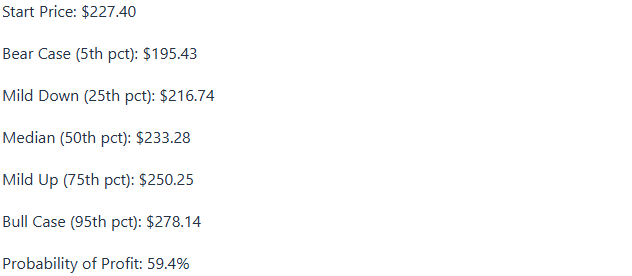
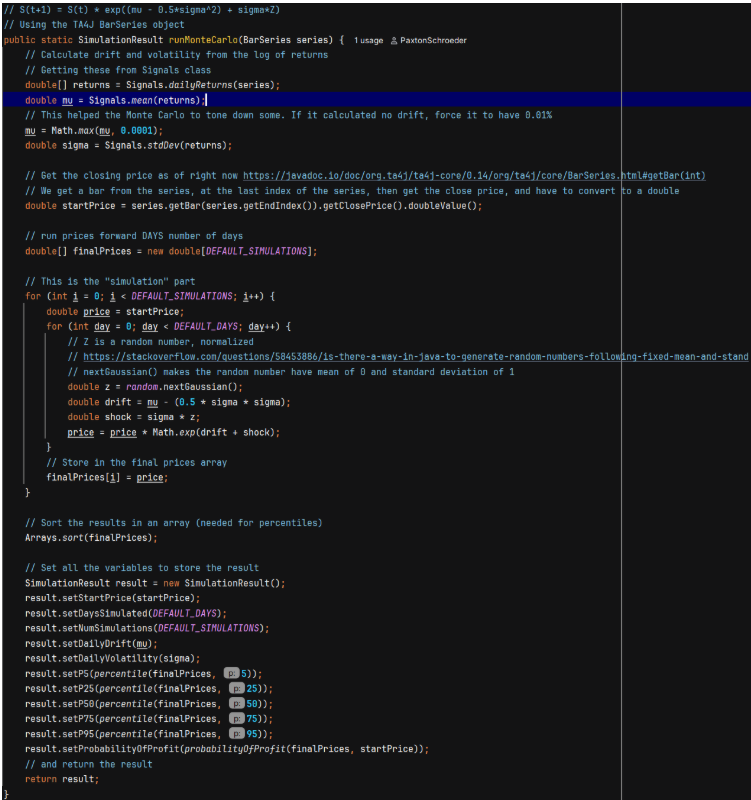
The Monte Carlo Simulation breaks down the range of possible future price outcomes into five percentile-based scenarios. Rather than giving a single price predication, this approach shows a distribution of where the stock could realistically end up. The platform also calculates a Probability of Profit, which in this example came out to 59.4% for Boeing, giving the user a decent sense of the risk they’re taking before placing a trade.
This is the code that makes this simulation work:
Reflection
Working on this project taught me a lot about what it actually takes to integrate external APIs into a real application. Reading through documentation and sometimes having to make guesses about parameters gave me a more realistic picture of software development.
One of my main contributions to the project was implementing the sector classification feature, which uses the Finnhub API to fetch and display what sector a given stock belongs to, whether that be energy, technology, healthcare, etc. It adds meaningful context to an analysis by helping users understand the broader market environment a stock is in, and if this project were expanded we could implement a graph of all sectors owned.
Collaborating on shared files was a new challenge. Learning how to use GitHub, even just the basic things was something I had no real experience with, and I now feel confident using it in a team environment.
This project pushed me to think like a problem-solver rather than just a programmer. When something didn’t work, there wasn’t a textbook answer to fall back on. We had to work together to read and experiment, which is an experience that will stick with me long after this course concludes.